How to Measure Health Indicators
Tracking your health can feel overwhelming, especially when you’re unsure which numbers matter or how to interpret them. You’re not alone—many people struggle to measure health indicators consistently and turn scattered readings into useful insights. The right tools can make the process simpler and more reliable.
You can measure health indicators by setting clear goals, choosing relevant measures, and using validated tools consistently. Track essential signs, body metrics, habits, mental well-being, healthcare access, and outcomes at regular intervals.
Record the date, time, conditions, and influencing factors, then review trends instead of isolated results. Calibrate devices, repeat unusual readings, and consult professionals when needed.
Compare rates fairly by accounting for age and population differences, and investigate the following guidance for more accurate assessment.
Key Takeaways
- Define clear health objectives, populations, timeframes, outcomes, and review intervals before selecting indicators.
- Choose validated, goal-relevant indicators, such as blood pressure, vaccination coverage, incidence, mortality, or mental-health scores.
- Use standardized protocols, calibrated tools, consistent conditions, trained personnel, and repeated measurements to improve accuracy.
- Record results systematically with dates, times, influencing factors, case definitions, and reliable data sources.
- Analyze trends using appropriate rates, demographic stratification, uncertainty measures, and professional interpretation to guide action.
Understand What Health Indicators Measure

Health indicators are measurable signs that show the health status of a person or population. They help you understand patterns in physical, mental, and social well-being.
Health indicators provide measurable insights into individual and community well-being across physical, mental, and social dimensions.
Instead of describing health broadly, each indicator focuses on a specific condition, behavior, or outcome. You might examine blood pressure, body mass index, vaccination rates, sleep quality, or rates of illness.
These measures can reveal whether your body functions within a healthy range or whether a community faces increased health risks. Mortality, life expectancy, and disease prevalence indicate population health, while heart rate, stress levels, and mobility offer personal insight.
Lifestyle habits strongly affect many indicators. Your diet, activity level, tobacco use, alcohol consumption, and sleep routine can change measurable results over time.
Environmental factors matter, too. Air quality, housing conditions, workplace safety, access to nutritious food, and healthcare availability can influence your health.
Set Goals for Measuring Health
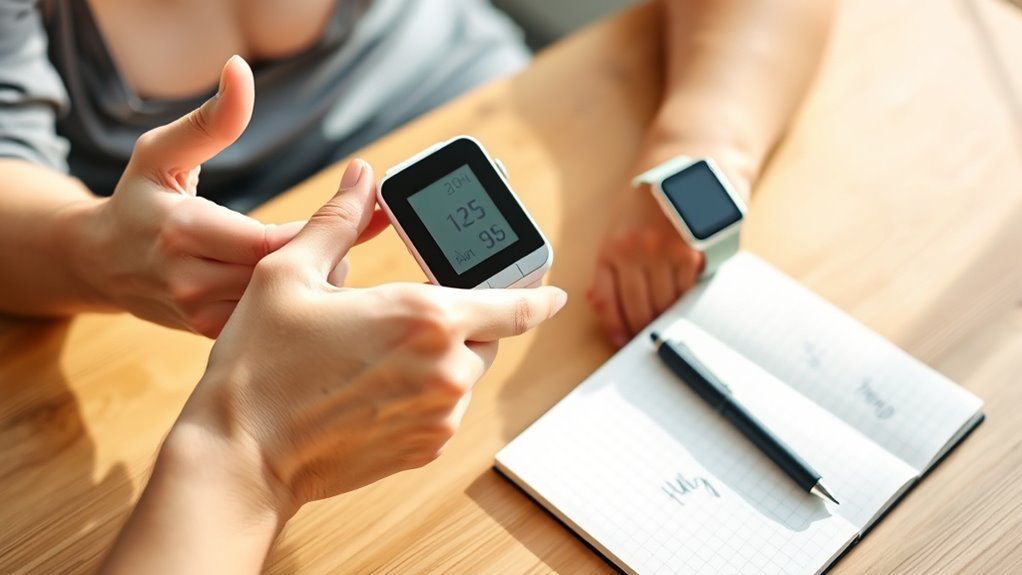
Before you measure a health indicator, decide what you want to learn or change. A clear goal gives your tracking purpose and helps you focus on useful progress.
State what you’ll measure, why it matters, and when you’ll review it. Keep your target specific and realistic, such as improving energy, building consistency, or supporting a health professional’s plan.
| Goal | Tracking focus | Review point |
|---|---|---|
| Eat more balanced meals | Diet tracking | Each weekend |
| Move consistently | Exercise frequency | Every two weeks |
| Improve sleep habits | Bedtime consistency | After one month |
Choose a timeframe that’s long enough to reveal patterns but short enough to maintain motivation. Write your goal in one sentence, and define success before you begin.
For example, you might aim to record meals five days weekly or complete three workouts per week for four weeks. Revisit your goal regularly, celebrate small wins, and adjust the target when your circumstances change.
Keep the emphasis on learning, not perfection.
Choose Reliable Health Indicators
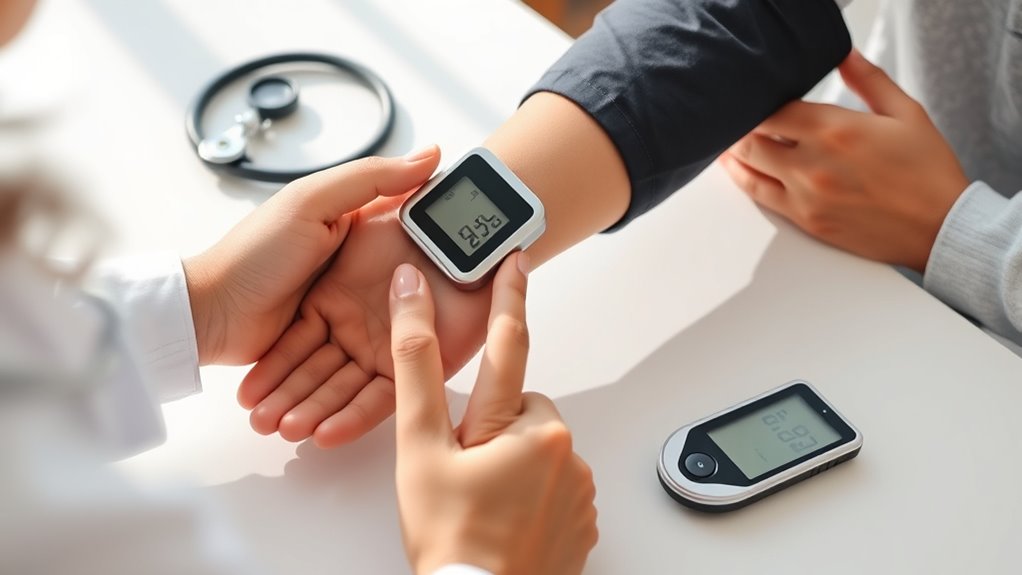
Choose indicators that directly reflect your goal and that you can measure consistently. If you want to improve heart health, track blood pressure, cholesterol, or aerobic capacity rather than unrelated numbers. For weight management, consider body weight, waist circumference, hunger levels, and energy intake.
Choose consistent indicators tied directly to your health goals, such as blood pressure, waist circumference, or energy intake.
Select measures that show meaningful change and connect to actions you control.
Match each indicator to a clear definition. “Eat better” is vague, but servings of vegetables, sugary drinks per week, or fiber intake create measurable targets. Your Dietary habits should capture patterns that matter to your goal, not every detail of your meals.
Likewise, exercise routines may include weekly activity minutes, strength sessions, or daily steps, depending on the outcome you’re pursuing.
Choose a manageable set of indicators. Too many measures can overwhelm you and distract from useful trends. Favor indicators with established links to health outcomes, and ask a qualified professional for guidance when interpretation requires medical expertise.
Reliable indicators make your progress easier to understand and act on.
Standardize Tools, Timing, and Records
Use the same measurement tools each time so your results are more accurate and easier to compare. Record your health indicators on a regular schedule, and note any changes in timing. Keeping your tools and schedule consistent makes it easier to spot meaningful changes.
Standardize Measurement Tools
How can you measure health indicators consistently if your tools and procedures keep changing? Choose reliable instruments that match the indicator you’re tracking, whether you’re checking temperature, blood pressure, weight, or another measure.
Use the same model whenever possible, because different devices may produce different results. Before each use, inspect your equipment for damage, confirm its settings, and calibrate it according to the manufacturer’s instructions.
Keep a simple checklist so you won’t overlook essential steps. Train everyone who collects information to follow the same technique, placement, and interpretation guidelines.
Document the tool’s brand, model, and calibration status in your records. Consistent equipment and clear instructions strengthen data collection and improve measurement accuracy.
Replace faulty devices promptly, and validate new tools against a trusted standard before relying on their results.
Schedule Consistent Recording Times
Record each health indicator at the same time and under similar conditions whenever possible. A consistent schedule helps you compare results fairly and spot meaningful changes.
For example, measure your blood pressure after resting, check your temperature before strenuous activity, and record your weight at a similar time each day.
Note factors that could affect readings, such as meals, exercise, stress, medication, or sleep. You don’t need perfect conditions, but you should document important differences.
Use the same schedule for home monitoring and bring your records to Routine checkups. Your clinician can interpret trends more effectively when dates and times are clear.
Consistent timing improves Data accuracy, reduces confusion, and helps you recognize when a result reflects a real change rather than a temporary variation. Set reminders so you’ll follow your plan.
Measure Vital Signs and Body Metrics
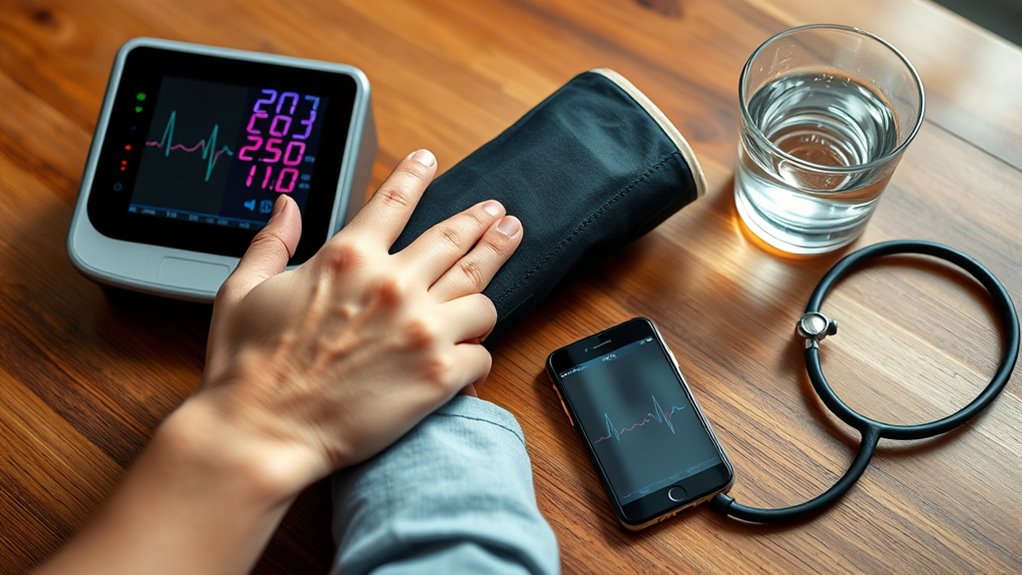
Essential signs and body metrics give you a practical snapshot of your health. Measure your temperature, pulse, breathing rate, and blood pressure with reliable, properly maintained devices.
Track key vital signs with reliable equipment to build a clear, practical snapshot of your everyday health.
Sit quietly for several minutes first, follow each device’s instructions, and record the results with the date, time, and measurement conditions. Consistent technique helps you notice meaningful changes rather than random variation.
Track your weight, waist circumference, and, when appropriate, body composition. Use the same scale, clothing level, and measurement location each time.
Don’t interpret one reading in isolation. Review patterns across weeks and consider how sleep, stress, hydration, Nutritional intake, and Physical activity may influence results.
Keep your records in a notebook or app so you can compare measurements easily. If a reading seems unusual, repeat it after resting and checking your technique.
Seek professional guidance for persistent concerns, severe symptoms, or measurements outside your clinician’s recommended range. These practices help you understand your baseline and make informed daily choices.
Track Disease, Mortality, and Risk Rates
Track disease incidence rates to understand how often new cases occur in a population. You can also review mortality trends over time and assess the health risk factors that may influence both outcomes.
Disease Incidence Rates
Disease incidence rates show how often new cases of a disease occur within a specific population and time period. To calculate an incidence rate, divide the number of new cases by the population at risk, then express the result per a standard unit, such as 1,000 or 100,000 people.
You’ll need a consistent case definition, accurate reporting, and a clearly defined observation period. Compare rates across locations, age groups, or years only after adjusting for differences in population structure and data quality.
You can also examine factors linked to new cases, including genetic markers, environmental exposures, behaviors, and access to care. Rising incidence may signal increased transmission, improved detection, or a changing risk profile.
Track these rates regularly to identify emerging patterns and guide prevention efforts.
Mortality Rate Trends
Mortality rate trends show how deaths from a disease change across populations and time. To measure them, you’ll compare the number of deaths with the population at risk during a defined period.
Report rates per 1,000 or 100,000 people so you can compare communities, years, and disease groups fairly. Separate crude rates from age-standardized rates; the latter reduce distortion when populations have different age structures.
Track trends with line charts, confidence intervals, and consistent case definitions. Examine changes by sex, location, and age group through demographic analysis, while noting incomplete records or delayed reporting.
You’ll then interpret whether mortality is rising, falling, or remaining stable. These findings can guide health policy, resource allocation, and evaluation of treatment programs without confusing deaths with new cases or disease prevalence.
Health Risk Factors
When you track health risk factors, measure how behaviors, exposures, and social conditions influence disease rates, mortality, and other health outcomes. Start by defining your population, timeframe, and outcomes.
Then compare risk exposure with disease incidence, case-fatality, mortality, and hospitalization rates. Use surveys, medical records, registries, and environmental monitoring to collect consistent data.
- Lifestyle habits: Track smoking, alcohol use, diet, physical activity, and sleep.
- Environmental factors: Measure air pollution, water quality, heat, toxins, and workplace hazards.
- Social conditions: Examine income, housing, education, access to care, and discrimination.
- Risk rates: Calculate prevalence, incidence, relative risk, and population-attributable risk.
Stratify results by age, sex, location, and other relevant groups to reveal disparities. Adjust for confounding variables, check data quality, and report uncertainty.
Compare findings over time to evaluate prevention programs and guide resource allocation effectively.
Track Mental Health and Quality of Life
Track mental health and quality of life alongside physical health indicators to understand how well people function and feel day to day. Use brief, validated surveys to assess mood, stress, sleep, social connection, energy, and ability to manage daily activities.
Ask people to rate their well-being consistently, such as monthly, so you can identify meaningful changes.
| Indicator | What to track |
|---|---|
| Mental health | Mood, anxiety, stress, and coping |
| Quality of life | Sleep, energy, relationships, and daily function |
Combine survey results with open-ended questions. Encourage people to describe what affects their well-being, then protect privacy when collecting responses.
Review trends rather than treating one score as a diagnosis. If someone reports persistent distress, declining function, or thoughts of self-harm, guide them toward qualified mental health support promptly.
You can also track protective habits, including Mindfulness practices, physical activity, social connection, and routines that strengthen Emotional resilience. Compare results across time, groups, or settings to reveal disparities and target supportive interventions.
Measure Access, Affordability, and Care Quality
Measure how easily people can obtain needed care, afford it, and receive services that are safe, timely, effective, and respectful. Start by defining a population, setting, and measurement period. Then gather patient surveys, clinic records, claims, and community data.
Measure access, affordability, and quality by defining the population, setting, timeframe, and data sources.
Track practical indicators such as:
- Appointment wait times and travel distance
- Insurance coverage, out-of-pocket costs, and unpaid bills
- Preventive-care use and treatment completion
- Safety events, communication, and patient experience
Disaggregate results by income, race, ethnicity, age, disability, language, and location. This approach can reveal health disparities that overall averages hide.
Ask patients about access barriers, including transportation, limited clinic hours, digital access, language differences, stigma, and confusing paperwork.
Measure affordability by checking premiums, copayments, medication prices, and whether costs cause people to delay care.
Assess quality with validated measures for coordination, follow-up, clinical safety, and respect. Protect privacy, use consistent definitions, and document data sources.
Share findings with patients, care teams, and community partners so they can address gaps responsibly.
Compare Results and Spot Health Trends
Compare results across time periods, locations, and population groups to identify meaningful health trends. Review rates, averages, and changes together rather than relying on one number.
You’ll see whether a condition is improving, worsening, or remaining stable. Use consistent measures and note the period each result represents, so comparisons remain meaningful.
| Comparison | What you might learn |
|---|---|
| Year to year | Whether health outcomes are improving |
| Region to region | Where services or risks differ |
Next, examine possible explanations for noticeable patterns. Lifestyle habits, such as physical activity, diet, and sleep, may influence results.
Environmental factors, including air quality, housing, and workplace conditions, can also shape health outcomes. Compare related indicators to strengthen your interpretation.
For example, rising vaccination coverage alongside fewer infections may suggest a connected trend. Break results into relevant groups, such as age or income, to reveal differences hidden in overall totals.
Then summarize the direction, size, and duration of each trend. Clear visualizations, such as line graphs or maps, can help you communicate findings and support informed health decisions.
Share insights in plain language, highlighting changes that deserve attention.
Avoid Common Health Measurement Errors
After identifying health trends, check your methods for errors that could distort the results. Start by defining each indicator clearly, then use consistent tools, timing, and procedures.
Check your methods carefully: define indicators clearly and apply consistent tools, timing, and procedures to produce reliable health findings.
If you change your approach midway, your comparisons may mislead you.
Watch for these common problems:
- Sampling bias: Include diverse participants, not only people easiest to reach.
- Small samples: Gather enough observations to support dependable inferences.
- Recall errors: Ask specific, timely questions instead of relying on distant memories.
- Confounding factors: Record variables such as age, medication, income, and environment.
Calibrate devices regularly, train data collectors, and repeat unusual measurements. Review missing values and outliers before calculating averages, and don’t quietly delete inconvenient results.
Compare your findings with established benchmarks, and document every adjustment so others can evaluate your process.
Protect participants throughout the project. Limit access, remove unnecessary identifiers, and explain how you’ll use information to support data privacy.
Finally, report uncertainty alongside results. Transparent limitations strengthen trust and help you improve measurement accuracy in future assessments.
Frequently Asked Questions
Who Should Review My Health Measurements With Me?
Your healthcare provider should review your health measurements with you, especially when results seem unusual or change over time. They can assess measurement accuracy, explain what each number means, and connect the findings to your symptoms, medications, and personal health goals.
You can also involve a nurse, pharmacist, or registered dietitian when appropriate. Bring your records, device details, and questions so you’ll receive clear, personalized guidance and know when follow-up is needed.
How Can I Protect the Privacy of Collected Health Data?
You can protect collected health data before it becomes the internet’s next gossip column. Use strong passwords, multifactor authentication, and role-based access so only approved people can view it.
Enable data encryption during storage and transmission, and apply anonymization techniques before sharing information for research. Choose reputable apps, read privacy policies, limit permissions, and update software promptly.
Ask providers how they store, use, retain, and delete your measurements.
What Health Measurement Apps Integrate With Electronic Medical Records?
You can use health measurement apps such as Apple Health, Google Fit, Fitbit, Withings, and device-specific platforms that connect with electronic medical records through systems like Apple Health Records, HealthKit, or FHIR-based integrations.
Check whether your healthcare provider supports the app before sharing data. Prioritize data accuracy, strong privacy controls, and app compatibility.
You’ll often need to authorize access, review permissions, and confirm imported measurements with your clinician.
How Much Does Professional Health Measurement Support Typically Cost?
You’ll typically pay $50–$150 per session for professional health measurement support, while monthly packages range from $100–$500. Think of it like choosing a fitness coach: my neighbor paid $120 for one detailed assessment, then used monthly check-ins.
Your cost comparison should include credentials, testing depth, follow-up, and insurance coverage. Service providers may charge more for specialized monitoring, home visits, or integrated electronic records. Ask about setup, reporting, and cancellation fees.
When Should Unusual Measurement Results Prompt Emergency Medical Attention?
Seek emergency medical attention when unusual results accompany severe symptoms, sudden changes, or readings that threaten essential functions.
Call emergency services for chest pain, difficulty breathing, fainting, confusion, one-sided weakness, uncontrolled bleeding, or dangerously high or low glucose, blood pressure, oxygen, or temperature readings.
Treat urgent alerts seriously, especially when symptoms worsen. Don’t wait for repeat testing during symptom escalation; contact clinicians promptly for persistent, concerning abnormalities without severe symptoms.
Conclusion
You can measure health with more than a single number. Choose reliable indicators, use the same tools and timing, and record results consistently.
Track body metrics alongside mood, daily function, access, affordability, and care quality to see the fuller picture.
If measurement feels complicated, start with a simple dashboard: vital signs + mental well-being + care access → health trends.
Review changes over time, avoid misleading comparisons, and use your findings to guide informed conversations with your clinician. This approach helps you measure health more meaningfully.